
BIM 4D and BIM 5D
How to measure BIM Models and create a Gantt Diagram of times and activities using Revit, Navisworks or Presto: an Introduction
To measure BIM models and create a Gantt diagram measurement tables for each activity or task will be established, considering the 3D models using Revit, Navisworks, Presto or others modulation software. Any design change or the results of clashes detections will reproduce the necessary modifications in the measurement results. In addition, these measurement results allow a list of work activities or tasks for the construction to be created.
The measurement units and results should be the same as those that apply to the common measurement rules: unit, length, area and volume, for instance.
Planning BIM 4D Projects
According to the type of work, the required supply of materials, equipment, human resources, or work labour is defined. A prevision of the work resource efficiency is considered and the number of resources is set, according with the amount of work for each activity or task (always considering the time available for the construction).
The main objective is to carry out a schedule analysis and understand the critical path method management, using Gantt charts or PERT/CPM diagrams. The analysis of the graph also enables the critical path to time control (progress and delays) to be Identified during the works.
For each work a task precedence analysis is made to clarify the most logical and economic path for work construction. Several hypotheses can be analysed to define the most efficient technical option.
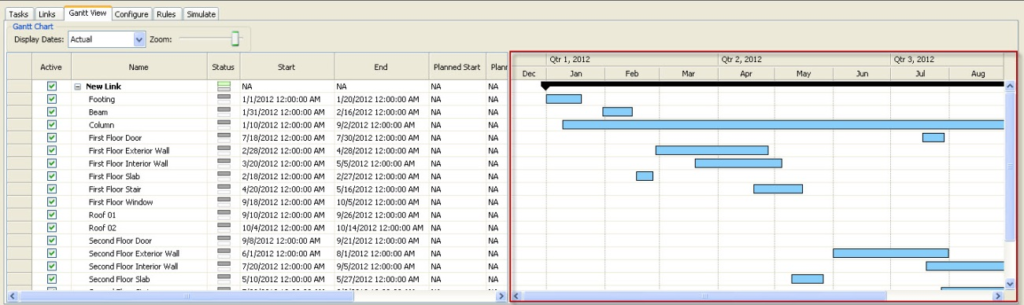
Therefore, the duration of the construction, the individual duration of each task and the total time are estimated. Each task will have a date to begin and a date to end, and could be represented, for instance, in a Gantt chart. The horizontal axis of the Gantt chart corresponds to the time duration of the task (such as minutes, hours, days, weeks, months, and years). The vertical axis represents the project task or the activities list of the construction.
In the Gantt chart, each task will have a time localization for its execution and duration tab. The chart view provides a visual representation of the several tasks. The task can run sequentially, in parallel, or overlapping.
Visually, a graphic representation is created to define a project timeline using management software, with an association of the necessary resources for each task (Figure 1).
With the visual representation of the tasks, it is possible to do a comparison between the planned date and the delay (or finishing ahead of time). This analysis enables the required changes to be made to the number of resources considered or to the duration of a task (extend or shorten). Any changes are automatically updated in the software task view. Likewise, modifying a field in the task view changes the corresponding field in the Gantt chart view.
Planning BIM 5D Projects
According to the work programming elaborated and a correct activities or tasks measurement, it is possible to produce a real cost analysis and the definition of the required resources for each one. This complete interaction is called a 5D BIM model.
For a more useful result, software that combines budgeting and management tools has to be used, to allow complete planning with real activities costs. This software could be Navisworks, with a more direct interaction with the previous modulation phases if Autodesk modulation software is used. However, it is possible to use other software such as Vico or Bexel Manager.
In this design phase, it is possible to study several hypotheses that will enable estimate cost for any construction option to be produced and a final cost for the construction to be defined.
Data with the cost of each resource can be created. As a result of the association with the required resources, according to the unit measurement and resources efficiency, a direct cost for the activity or task is generated.
It enables data to be created with the selling price of each activity or task. Thus, with the execution of a task, it is possible to control the direct cost (that the construction company will have with the resources affected) and a billing forecast, according to the budget accepted for the construction.
At the end, a financial schedule is defined for the direct costs and a basis for forecasting the billing of is the work carried out. With any change to the work program created, it is possible to view the financial adjustment that occurred and visualize the financial consequences of it.
The instant visualization of the deviation effect enables some correction to be made to the initial prevision of the required resources affected, analysing the project duration and the financial outcomes.